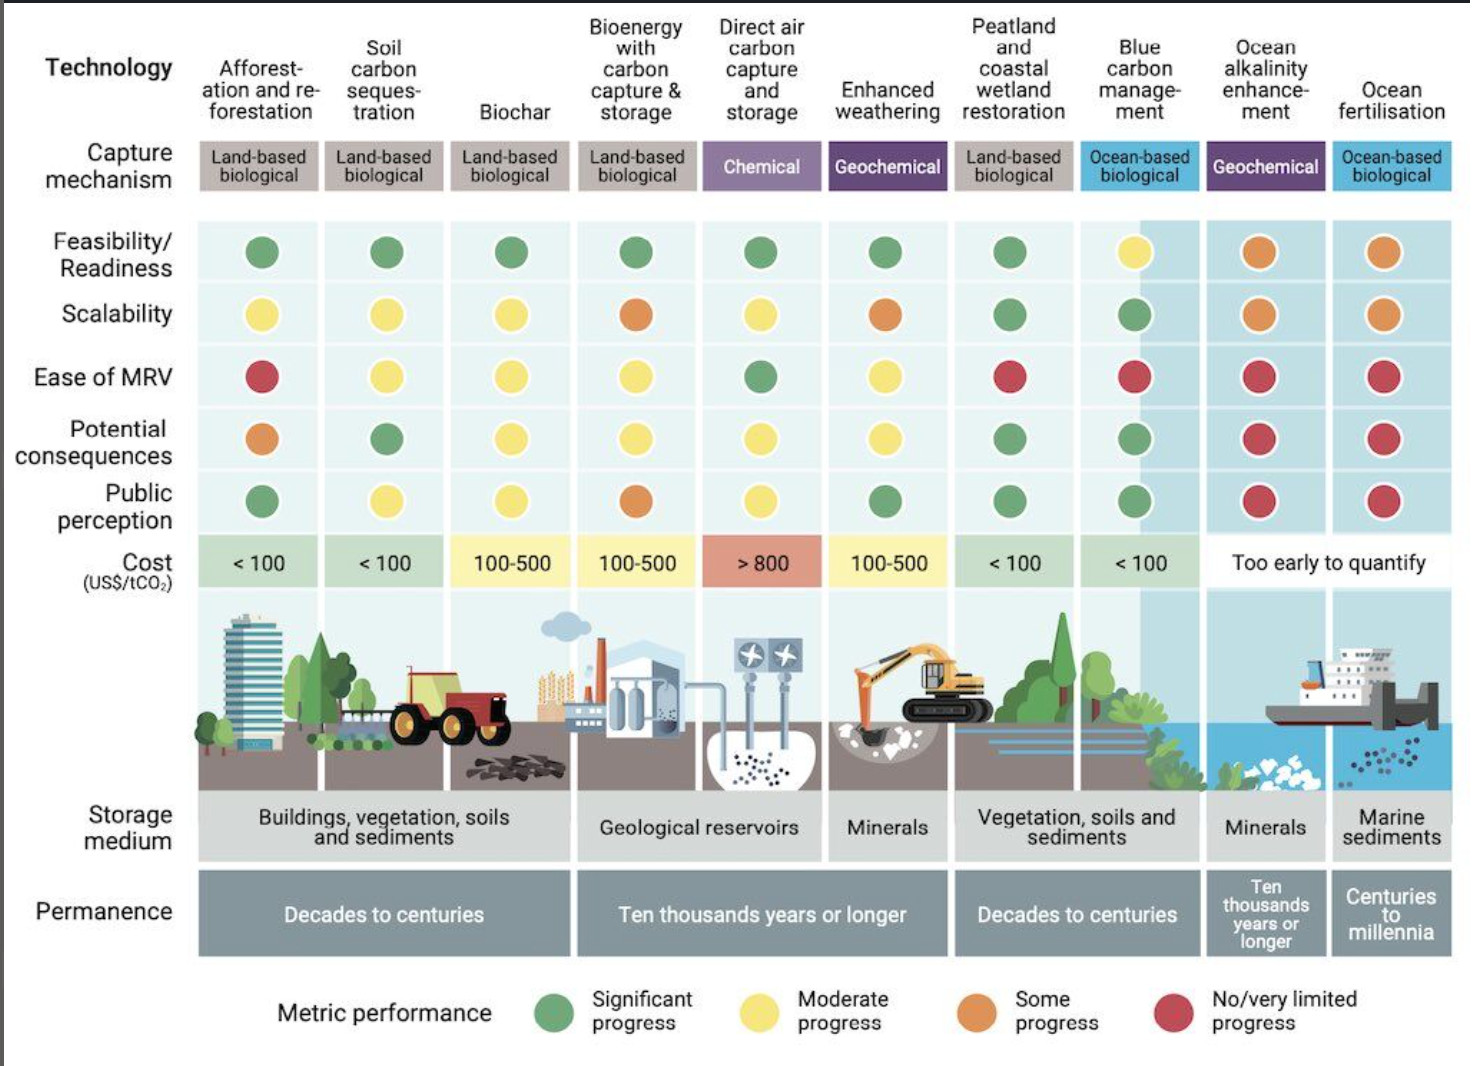
There is a lot of hype around carbon capture, but I’m willing to bet not a lot of clarity around what that actually means in practice. I found this visualisation from UNEP Emissions Gap Report chapter on CDR. It provides an overview of CDR method categories. NB: I’m sceptical about the whole thing, so file under “omvärldsbevakning”:
Coloured circles: progress toward the “ideal scenario”. Some factors probably fixed ( land use) while others may change over time (e.g. energy efficiency).
Note: No idea how they calculated this (don’t have time to read into details much). Going to guess the numbers assume a lot of this is happening in global south. So, count on maybe 10xCosts if people opt for CDR initiatives are in the North.